
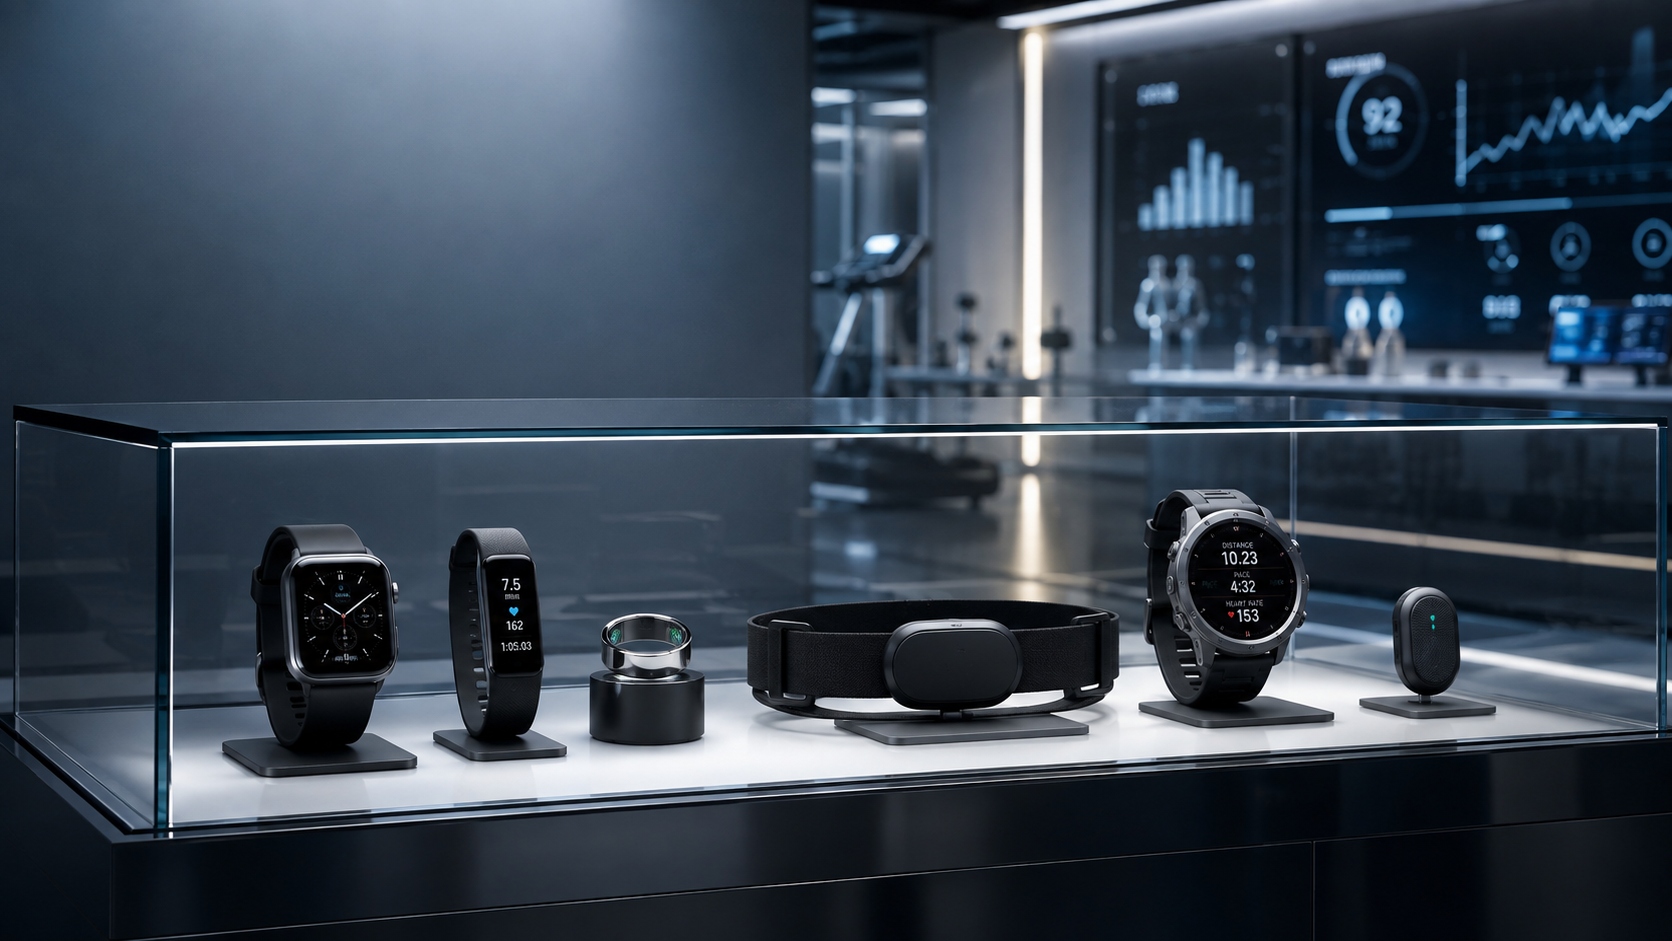
Harnessing the Power of Wearables Data for Peformance
The rise of wearable technology has profoundly impacted the way athletes train and recover. From tracking heart rate to estimating calorie burn, these devices provide an abundance of data aimed at improving performance and health. However, to extract meaningful insights, it's crucial to understand the nature of this data—specifically the distinction between direct measurements and estimates made by these devices.
The Growing Influence of Wearables
Wearables have become increasingly popular not only among professional athletes but also among the general public. Many individuals use these gadgets to monitor various health metrics, including sleep patterns, physical activity, and recovery states. Yet, this popularity often comes with mixed feelings. Some users wholeheartedly trust the metrics provided, while others remain skeptical, questioning the accuracy and reliability of the data.
Understanding Measurements vs. Estimates
The first vital step in utilizing wearables data effectively is to differentiate between what is measured and what is estimated by the device. Measurements are direct readings from sensors specifically designed for particular tasks, while estimates attempt to infer values based on indirect indicators, which can lead to inaccuracies.
Measurements
Wearable devices typically offer a variety of measurements, such as:
- Heart rate
- Heart rate variability (HRV)
- Body temperature
- Oxygen saturation (SpO2)
- Calories burned
- Sleep stages
These parameters are often captured directly through the wearable's sensors, leading to a closer approximation of the athlete's physiological state. However, it's worth noting that even direct measurements can suffer from errors, particularly in certain contexts, such as during physical movements when signal quality may decline.
Estimates
Conversely, estimates rely on algorithms to predict values based on related but not directly measured parameters. For instance, a wearable might estimate sleep stages by analyzing movement and heart rate variability. Although these can provide useful insights, they are fundamentally guesses and should be treated as such.
The Importance of Context
When interpreting data from wearables, the context in which the measurements are taken plays a critical role in their accuracy and validity. For example, measuring HRV can provide meaningful insights into an athlete's stress levels; however, its accuracy hinges on measuring conditions—ideally at rest and away from stressors, such as the first waking moments or during undisturbed sleep.
Skepticism towards Simplified Scores
Many wearables offer simplified scores for metrics like readiness, sleep quality, or stress levels. While these scores can be tempting for quick interpretations, they often lack objective benchmarks for validation. Athletes should approach these scores with skepticism and be aware that the oversimplification of physiological responses can lead to misleading conclusions.

Heart Rate Variability: Focus on the Trend, Not the Score
Heart rate variability, or HRV, measures the small differences in time between consecutive heartbeats. Although a perfectly steady heartbeat may sound healthy, greater beat-to-beat variation generally reflects a nervous system that can adapt effectively to changing demands.
HRV is influenced by the balance between the sympathetic nervous system, which supports the body’s fight-or-flight response, and the parasympathetic nervous system, which promotes rest, digestion, and recovery. A higher-than-usual HRV may suggest that your body is well recovered, while a lower-than-usual reading may appear during periods of stress, illness, fatigue, dehydration, poor sleep, alcohol consumption, or intense training.
However, HRV should not be treated as a universal performance score. Normal values vary widely because HRV is affected by age, genetics, hormonal changes, medications, fitness, sleep, emotional stress, and environmental conditions. Comparing your HRV with another person’s number is therefore much less useful than comparing it with your own established baseline.
Wearables can make HRV more actionable by measuring it consistently, particularly during sleep when movement, food, exercise, and other daytime variables are minimized. Even then, one unusually high or low reading rarely tells the full story. Look for changes that persist over several nights and consider them alongside sleep quality, resting heart rate, training load, stress, and how you feel.
The practical takeaway is simple: do not chase the highest possible HRV. Use your personal HRV trend as one piece of evidence when deciding whether to train hard, prioritize recovery, or investigate a repeated change in your health or routine.

Blood Oxygen Saturation: Use the Reading in Context
Blood oxygen saturation, commonly shown as SpO2, estimates the percentage of hemoglobin in your blood carrying oxygen. Because oxygen supports energy production and normal organ function, SpO2 can provide a useful snapshot of how effectively oxygen is being delivered throughout the body.
Smartwatches estimate SpO2 using optical sensors. The device shines light into the skin and analyzes how differently oxygenated and deoxygenated blood absorb or reflect that light. This gives the watch a convenient, noninvasive way to estimate blood oxygen during rest, sleep, exercise, or changes in altitude.
For many healthy people at sea level, SpO2 readings commonly fall between 95% and 100%. However, a person’s typical range may differ because of altitude, respiratory conditions, circulation, illness, and other individual factors. A single reading should therefore be considered alongside symptoms, recent activity, location, and the person’s normal pattern.
Wearable readings also have important limitations. Movement, loose watch placement, poor circulation, skin temperature, ambient light, and skin pigmentation can influence optical measurements. Consumer wellness devices are useful for observing general patterns, but they are not replacements for medical-grade equipment or a professional evaluation.
The practical takeaway is simple: use wearable SpO2 as a trend and awareness tool, not as a diagnosis. An unusual reading may be worth repeating while resting and wearing the device correctly. Consistently low readings—especially when paired with shortness of breath, chest discomfort, confusion, or bluish lips or skin—should not be dismissed simply because they came from a wearable. Pulse-oximeter data should always be interpreted alongside symptoms and other health information.

Heart-Rate Zones: Train by Effort, Not Pace Alone
Heart-rate training uses beats per minute rather than speed to estimate exercise intensity. Instead of trying to maintain the same pace in every condition, runners can use their heart rate to target a specific effort for a set amount of time. This makes heart-rate data one of the most practical wearable metrics for structuring endurance training.
One of its biggest benefits is preventing easy runs from becoming unintentionally hard. Staying within an appropriate lower-intensity zone can reduce accumulated fatigue and leave your legs fresher for intervals, tempo sessions, and races. Heart-rate monitoring can also help account for hills, heat, humidity, and other conditions that may make the same running pace require substantially more effort.
Most heart-rate zones are calculated as percentages of maximum heart rate. Age-based formulas such as “180 minus your age” offer a convenient starting point, but they are only estimates. Genetics, fitness, sex, hydration, altitude, temperature, and normal individual variation can all affect heart rate. A laboratory exercise test provides a more precise measurement, while experienced runners may use a structured field test to estimate their maximum.
The Runner’s World guide presents four general training zones:
- Zone 1: 60–70% of maximum heart rate — a comfortable effort suited to warming up, cooling down, and recovery.
- Zone 2: 70–80% — a relaxed, sustainable effort during which conversation remains possible.
- Zone 3: 81–93% — a comfortably hard effort where speaking is limited to short sentences.
- Zone 4: 94–100% — a very hard but sustainable effort often associated with approximately 5K intensity.
Zone 2 deserves particular attention because it develops the aerobic foundation needed to sustain longer efforts and support harder training. At this intensity, the body can steadily use oxygen to produce energy from fats and carbohydrates while keeping lactate accumulation under control. For endurance athletes, a large portion of weekly training is often completed at this sustainable intensity.
The practical takeaway is simple: use wearable heart-rate zones to match each workout to its purpose rather than chasing the fastest possible pace every day. Make sure your zones reflect your own physiology, and interpret heart rate alongside breathing, perceived effort, terrain, temperature, and workout goals. A wearable becomes most useful when the numbers help you keep easy sessions easy and reserve harder efforts for the days designed for them.

Calories Burned: Treat the Number as an Estimate
Metabolism is the collection of processes the body uses to convert food and drink into energy. That energy supports more than exercise. Even while resting, the body burns calories to breathe, circulate blood, regulate hormones, repair tissue, and maintain normal cellular function.
The calories a person burns each day generally come from three areas. The largest is basal metabolic rate, or the energy required to keep the body functioning at rest. The body also uses energy to digest and process food, while exercise and everyday movement account for the remaining expenditure. Muscle mass, body size, age, and body composition all influence resting energy needs.
Daily movement can vary more than many people realize. In addition to planned workouts, the body burns energy through nonexercise activity thermogenesis, often called NEAT. This includes walking around the house, cleaning, gardening, climbing stairs, standing, and even fidgeting. Mayo Clinic notes that these ordinary activities can account for a meaningful portion of total daily calorie expenditure.
This matters when interpreting calorie-burn estimates from a smartwatch. Wearables combine information such as heart rate, movement, age, sex, height, and weight to estimate energy expenditure. However, they cannot directly measure every factor that affects metabolism. Two people completing the same workout may burn different amounts of energy because of differences in body composition, fitness, movement efficiency, and physiology.
It is also easy to place too much importance on the idea of a “fast” or “slow” metabolism. Although metabolic rate contributes to total energy needs, Mayo Clinic explains that slow metabolism is not usually the main cause of weight gain. Body weight is influenced by a combination of food intake, physical activity, genetics, hormones, sleep, stress, and other lifestyle factors.
For most people, physical activity is the part of daily energy expenditure that can be changed most directly. Aerobic exercise increases calorie use during activity, while strength training supports muscle mass, which is one factor influencing basal metabolic rate. Frequent low-level movement throughout the day can also contribute substantially over time.
The practical takeaway is simple: use wearable calorie data to compare your own activity patterns, not as an exact accounting system. Look at whether active days consistently produce higher estimates than sedentary days, but avoid treating the displayed number as permission to eat a precise number of calories back. The trend is usually more useful than the total.

Sleep Stages: Look Beyond a Single Night’s Score
Sleep is not one continuous state. Throughout the night, the brain and body move repeatedly through four stages: three stages of non-rapid eye movement sleep, or NREM, followed by rapid eye movement sleep, or REM. A typical night includes approximately four to six cycles, although their length and composition can vary between people and from one night to the next.
Stage 1, or N1, is the lightest stage and marks the transition from wakefulness into sleep. Brain and muscle activity begin to slow, but it remains easy to wake the sleeper. This stage usually lasts only a few minutes before progressing into more stable sleep.
Stage 2, or N2, is a deeper form of light sleep. Body temperature falls, muscles relax, and heart rate and breathing begin to slow. People typically spend around half of their total sleep time in this stage, making it the largest part of normal sleep architecture.
Stage 3, or N3, is commonly called deep, slow-wave, or restorative sleep. Pulse, breathing, and muscle activity decrease, and it becomes more difficult to wake the sleeper. Deep sleep is associated with physical recovery, growth, immune function, memory, and other restorative processes. Most deep sleep tends to occur during the first half of the night.
REM sleep involves increased brain activity, rapid eye movements, vivid dreaming, and temporary paralysis of most voluntary muscles. It supports functions such as memory, learning, emotional processing, and creativity. REM periods generally become longer later in the night, which is one reason cutting sleep short may disproportionately reduce REM sleep.
Wearables attempt to estimate these stages using signals such as movement, heart rate, and heart-rate variability. A clinical sleep study can also measure brain activity, eye movements, and muscle tone, giving it access to signals that most wrist- and finger-worn devices cannot directly record. Research suggests that wearables can be useful for observing broad sleep patterns, but their estimates of individual stages vary by device and should not be treated as exact measurements.
This means an isolated report of “low deep sleep” or “poor REM” does not necessarily indicate a problem. Sleep architecture naturally changes with age, recent sleep patterns, alcohol intake, stress, medications, illness, and sleep disorders. Consumer sleep technology is not considered a replacement for a medical evaluation or laboratory sleep testing when a sleep disorder is suspected.
The practical takeaway is simple: use wearable sleep stages to identify recurring patterns, not to grade each night. Pay more attention to total sleep time, schedule consistency, awakenings, daytime energy, and trends across several weeks than to the exact amount of deep or REM sleep reported on one morning.
Developing a Strategic Approach
Athletes and coaches can benefit from adopting a more strategic approach to wearable data:
- Establish Clear Goals: Before diving into data analysis, outline specific performance or recovery goals.
- Focus on Direct Measurements: Prioritize data derived from precise measurements. This emphasis on hard data will bolster accountability in interpreting responses.
- Utilize Reference Standards: Whenever possible, compare wearable data against established reference systems, such as clinical tests like electrocardiograms or polysomnography for heart rate and sleep assessment.
- Monitor for Changes Over Time: Rather than reacting to momentary fluctuations, observe trends over time to derive more actionable insights.
Conclusion
As wearable technology continues to evolve, understanding the intricacies of data interpretation will be vital for athletes aiming to enhance their performance and wellbeing. By distinguishing between measurements and estimates, acknowledging context, and approaching simplified scores with caution, athletes can extract valuable, actionable information to support their training regimens.